
SAAS Tools for Investor Empowerment, Listed Asset Search, Portfolio Construction & Review
SAAS Tools for Investor Empowerment, Listed Asset Search, Portfolio Construction & Review
In today’s dynamic investment landscape, understanding risk and return is more crucial than ever. Whether you're managing your own wealth or overseeing client portfolios, Modern Portfolio Theory (MPT) provides a quantitative framework to help make smarter, more strategic investment decisions.
Introduced by Harry Markowitz in 1952, Modern Portfolio Theory is centered on the idea that investors can build optimal portfolios that maximize return for a given level of risk—or conversely, minimize risk for a given level of return. The key insight? Don’t look at assets in isolation—consider how they interact as a portfolio.
At the heart of MPT lies the Efficient Frontier: a curve representing the set of optimal portfolios that offer the highest expected return for a given level of risk (standard deviation). Any portfolio below this frontier is considered sub-optimal.
Enter the Sharpe Ratio, developed by Nobel laureate William F. Sharpe. It measures the excess return per unit of risk:
Sharpe Ratio = (Rp - Rf) / σp
Rp = Expected portfolio returnRf = Risk-free rate (e.g., Treasury bills)σp = Portfolio standard deviation (risk)A higher Sharpe Ratio indicates a better risk-adjusted return. It essentially answers the question: Are you being rewarded enough for the risk you’re taking?
To maximize the Sharpe Ratio:
In an age of information overload, AI-driven analytics, and market volatility, MPT’s principles remain incredibly relevant:
While powerful, MPT isn't perfect:
For this reason it is appropriate to make quantitative and/or qualitative adjustments which reflect expectations of future market conditions relative to the window used for risk and return calibration.
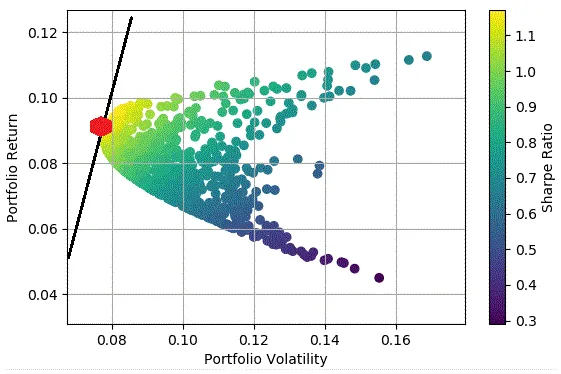
Below is a pictorial illustration of the Efficient Frontier and Sharpe Ratio maximization. The black line is the capital allocation line (CAL) and the red hexagon is a 100% allocation to the portfolio which represents the best return per unit of risk (or highest sharpe ratio). Points on the CAL below the red hexagon represent some combination of the risk free asset and the optimal market portfolio, above the red hexagon represents a levered optimal market portfolio (i.e. borrowing to invest in the optimal market portfolio):
Want to take your portfolio strategy to the next level? Understanding these principles is a great place to start.